PRIJS PER M² MORNANT
| Gemiddelde woningprijs per m² | Apr 2017 | 3 maanden | 1 jaar |
|---|---|---|---|
| Huis | EUR 2.262 | -13,4% | - |
| Huis (3 slaapkamers) | - | - | - |
| Huis (4 slaapkamers) | - | - | - |
| Huis (5 slaapkamers) | - | - | - |
| Huis (6+ slaapkamers) | - | - | - |
| Appartement | - | - | - |
| Appartement (1 slaapkamer) | - | - | - |
| Appartement (2 slaapkamers) | - | - | - |
| Appartement (3 slaapkamers) | - | - | - |
| Appartement (4 slaapkamers) | - | - | - |
| Appartement (5+ slaapkamers) | - | - | - |
| Grond | - | - | - |
MORNANT MARKTOVERZICHT
WONINGPRIJSTRENDS IN MORNANT
MORNANT VASTGOEDVERMELDINGEN
TE KOOP
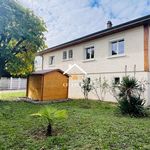
EUR 737.000
8 kamer(s) , 4 bad(en) , 540 m²
Zone industrielle et commerciale avec habitation MORNANT WONINGPRIJZEN SAMENVATTING
In april 2017, the average home price per m² in Mornant is between EUR 2.326 and EUR 2.658. The average home price per m², based on all types of homes, has gone up by 10,5% over the past year. The average price of houses is estimated at EUR 2.262 per m². The average price is calculated from listings data in Mornant on a monthly basis. The average price per m² reflects real estate offer but is not necessarily the sales price of homes. It gives you an idea of listing prices of homes for sale. For a more accurate assessment of your real estate click « Estimate my home »
VASTGOEDPRIJS PER M² IN NABIJ GELEGEN STEDEN
| Stad | Gem. Prijs per m² woning | Gem. Prijs per m² appartement | Gem. Huurprijs per m² woning | Gem. Huurprijs per m² appartement |
|---|---|---|---|---|
| Givors | EUR 1.866 | EUR 1.627 | - | - |
| Rive-de-Gier | EUR 1.659 | EUR 1.261 | - | EUR 6,61 |
| Craponne | EUR 3.242 | EUR 3.302 | - | - |
| Sainte-Foy-lès-Lyon | - | EUR 3.516 | - | EUR 11,29 |
| Saint-Fons | - | EUR 2.214 | - | - |
| Tassin-la-Demi-Lune | EUR 3.258 | EUR 3.291 | - | EUR 12,60 |
| Vénissieux | - | EUR 2.090 | - | EUR 11,36 |
| Écully | - | EUR 4.038 | - | - |
| Saint-Chamond | EUR 1.530 | EUR 1.297 | - | - |
| Lyon | - | EUR 3.224 | - | EUR 13,64 |
| Lyon 1er arrondissement | - | EUR 4.222 | - | EUR 15,12 |
| Lyon 3e arrondissement | - | EUR 3.899 | - | EUR 13,19 |
| Lyon 4e arrondissement | - | EUR 4.162 | - | EUR 13,67 |
| Lyon 5e arrondissement | - | EUR 3.146 | - | EUR 13,18 |
| Lyon 8e arrondissement | - | EUR 2.701 | - | EUR 13,14 |
| Lyon 9e arrondissement | - | EUR 2.827 | - | EUR 14,61 |
| Villeurbanne | EUR 2.941 | EUR 2.840 | - | EUR 14,27 |
| Bron | - | EUR 2.362 | - | EUR 12,39 |
| Vaulx-en-Velin | EUR 2.564 | EUR 2.296 | - | EUR 10,91 |
| Rhône | EUR 2.339 | EUR 2.815 | - | EUR 12,69 |


